
Page 22 - annual report 1402
P. 22
Power Market
22 Annual Report
1402
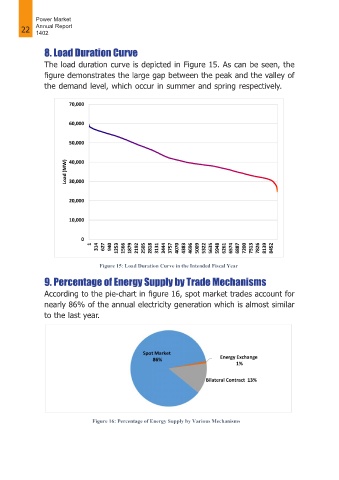
8. Load Duration Curve
The load duration curve is depicted in Figure 15. As can be seen, the
figure demonstrates the large gap between the peak and the valley of
the demand level, which occur in summer and spring respectively.
9. Percentage of Energy Supply by Trade Mechanisms
According to the pie-chart in figure 16, spot market trades account for
nearly 86% of the annual electricity generation which is almost similar
to the last year.